Omega ‑ Order Tracking Analytics
Order Tracking Analytics
1. Shipment Report
Summarize the performance of Delivery service in terms of
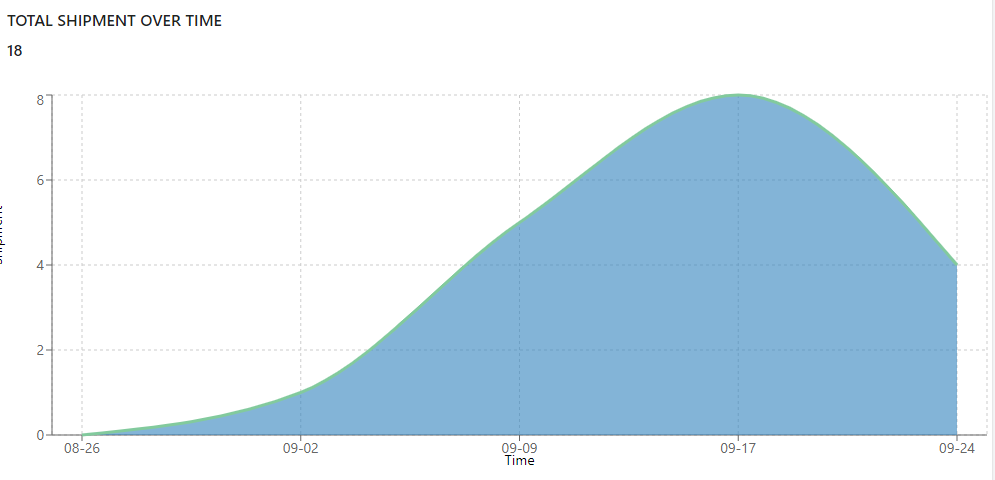
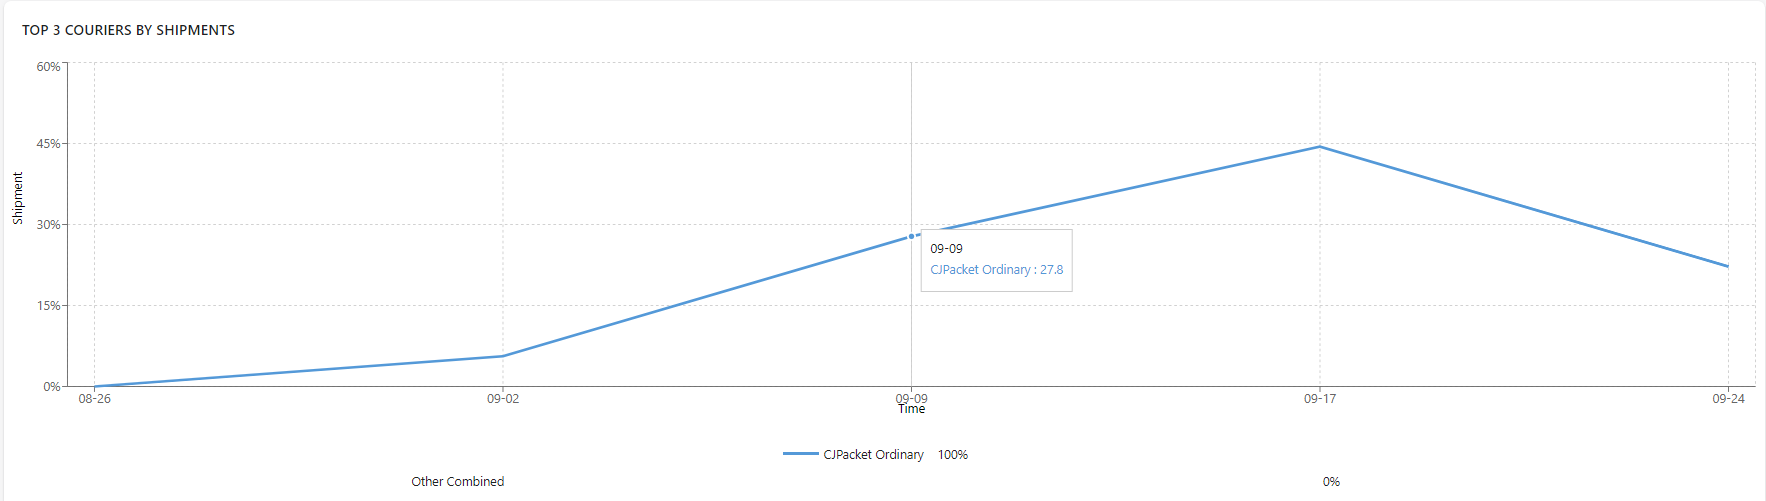
- Total Shipment over time: Total shipment per a period
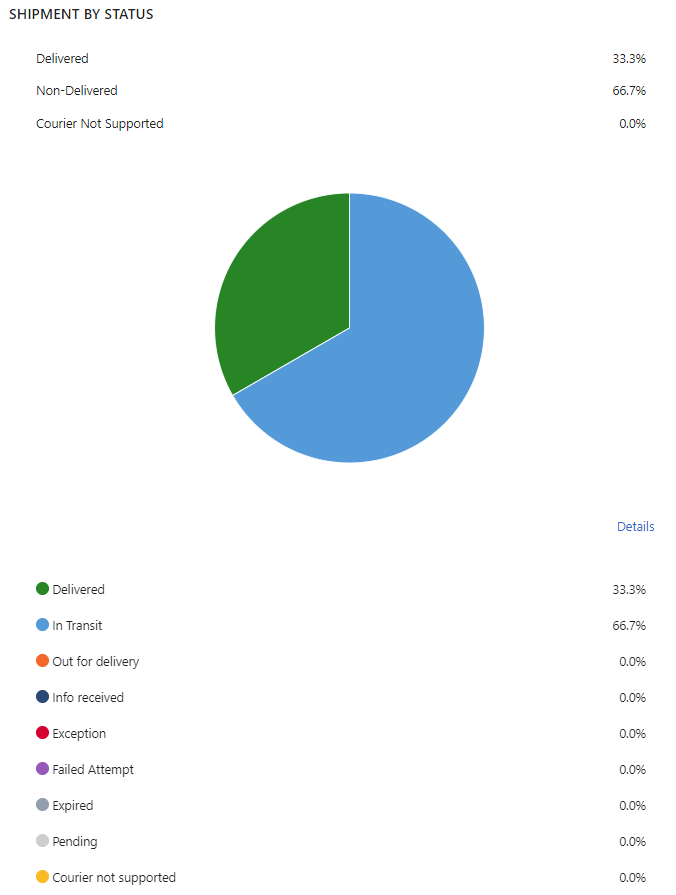
- Shipment by status: The number of shipments based on their status
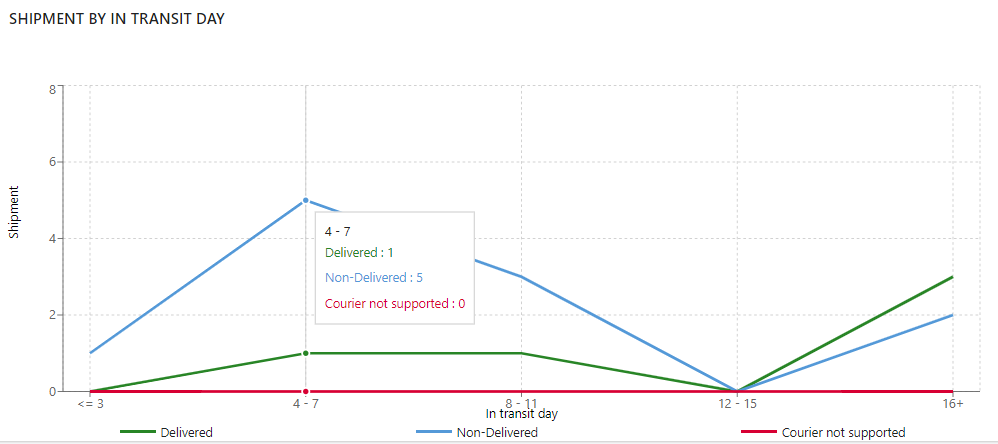
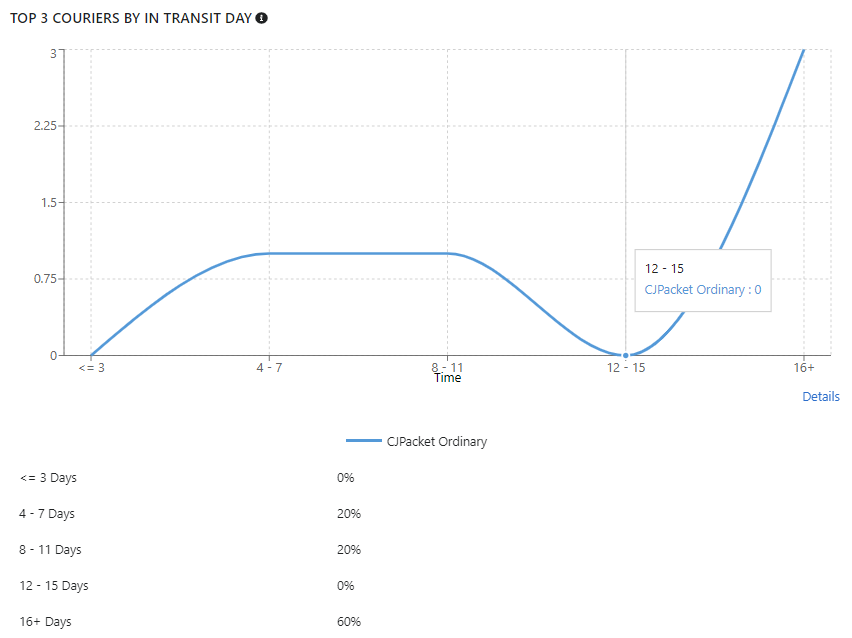
- Shipment by In transit day:The number of delivered/undelivered shipments based on the duration of transit time
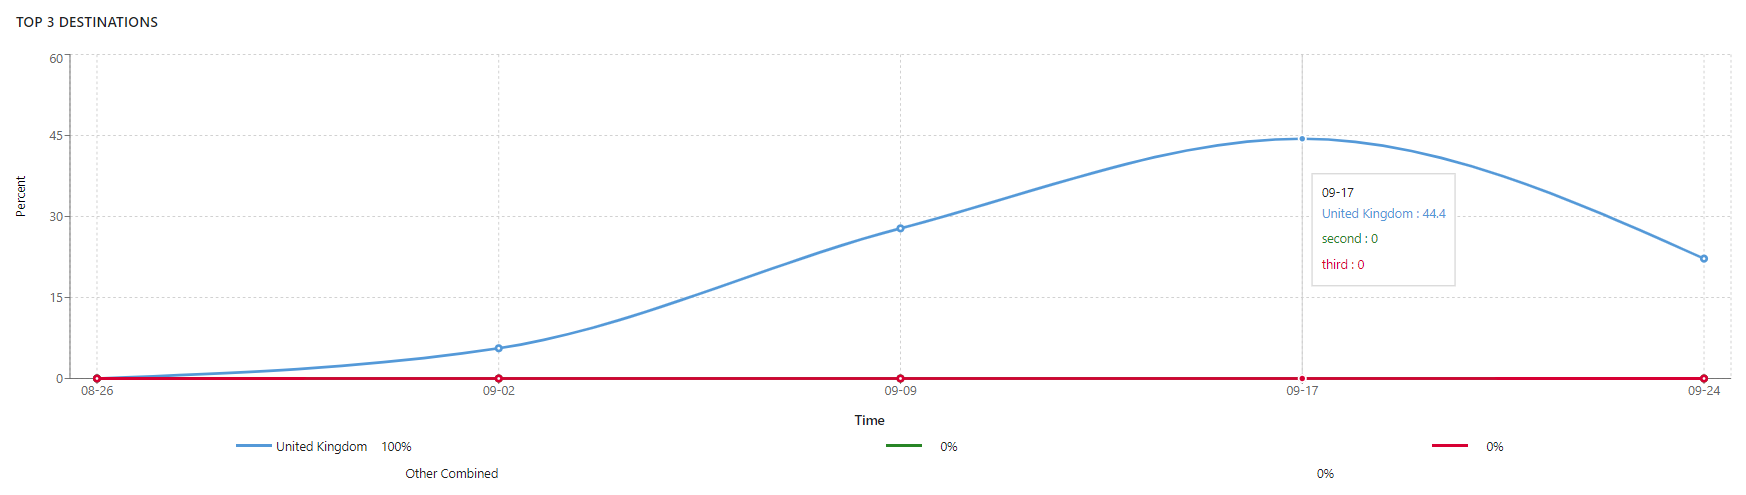
-
Top 3 Destinations graph: The top 3 destinations most of the shipments were delivered to
2. Courier Report
Extract the Top 3 couriers that:
- Are used the most based on the total shipments they have shipped
- Are fastest based on the average shipping time they have used
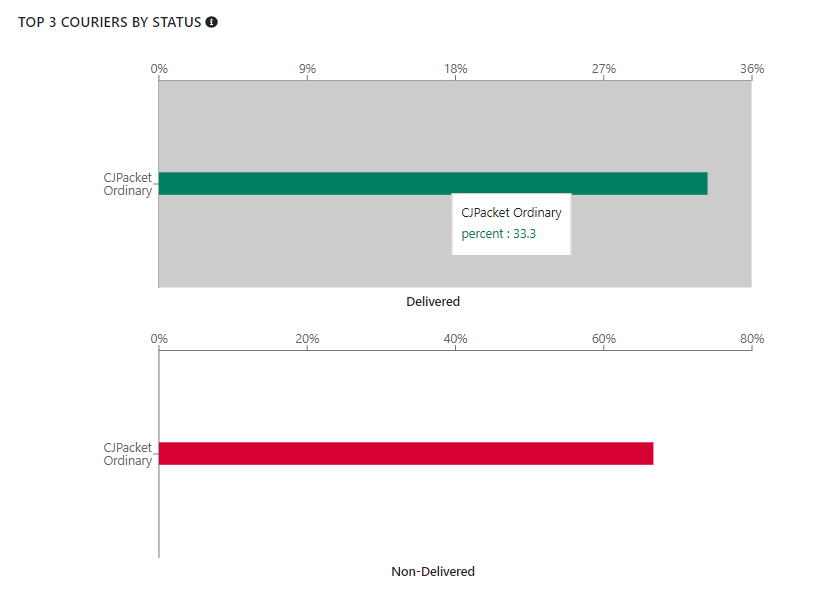
- Are most effective regarding the highest percentage of delivered shipments they have shipped
From these, you as a merchant could evaluate the couriers you are using and decide to continue using their top 3(s) or change their delivery partners.
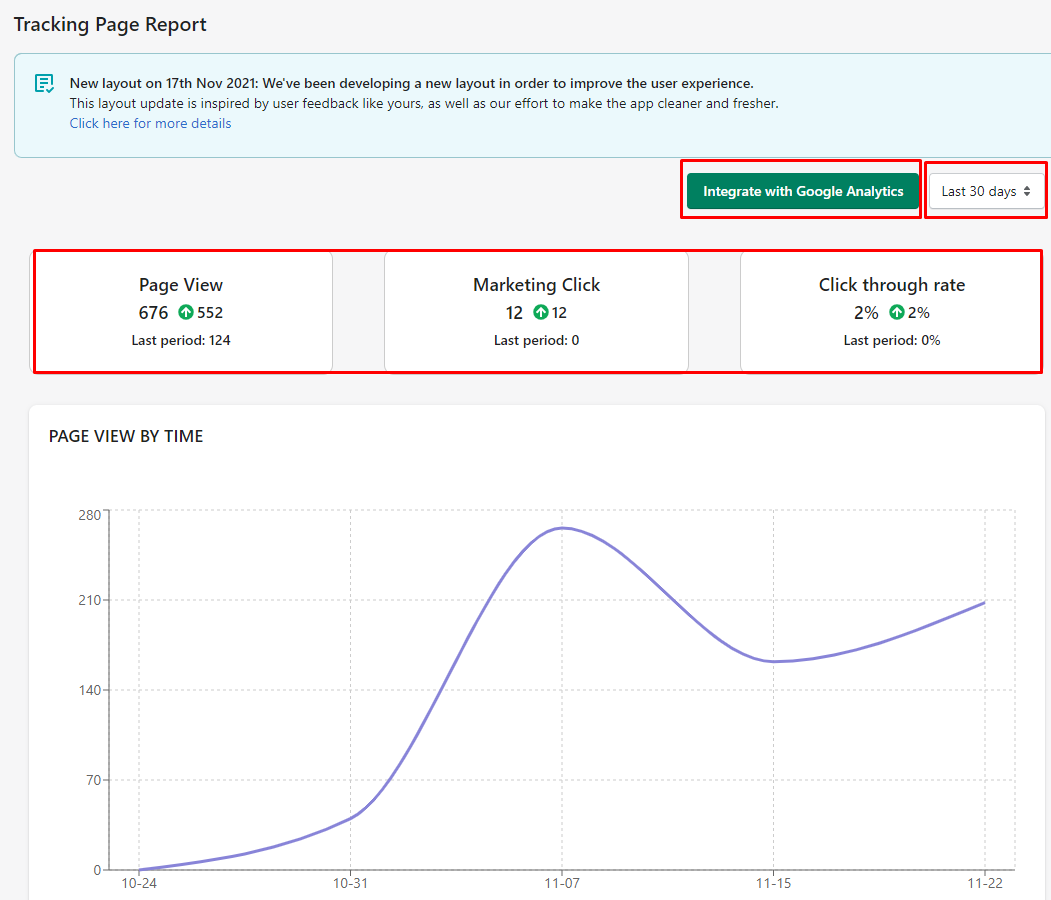
3. Tracking Page Report
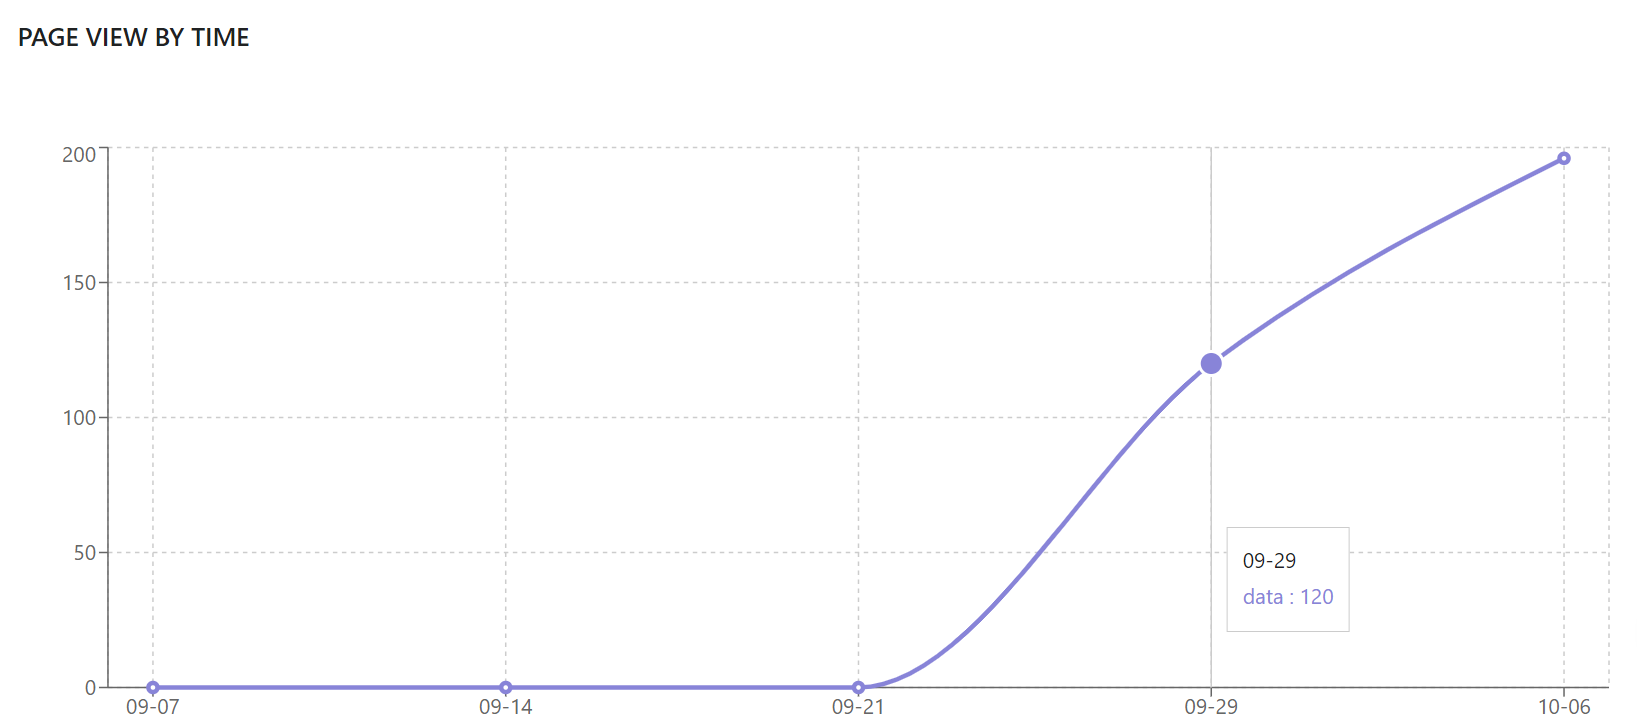
- Page view number + Pave view by time graph
The chart shows how many times the tracking page has been viewed in a time range and in comparison with the last period.
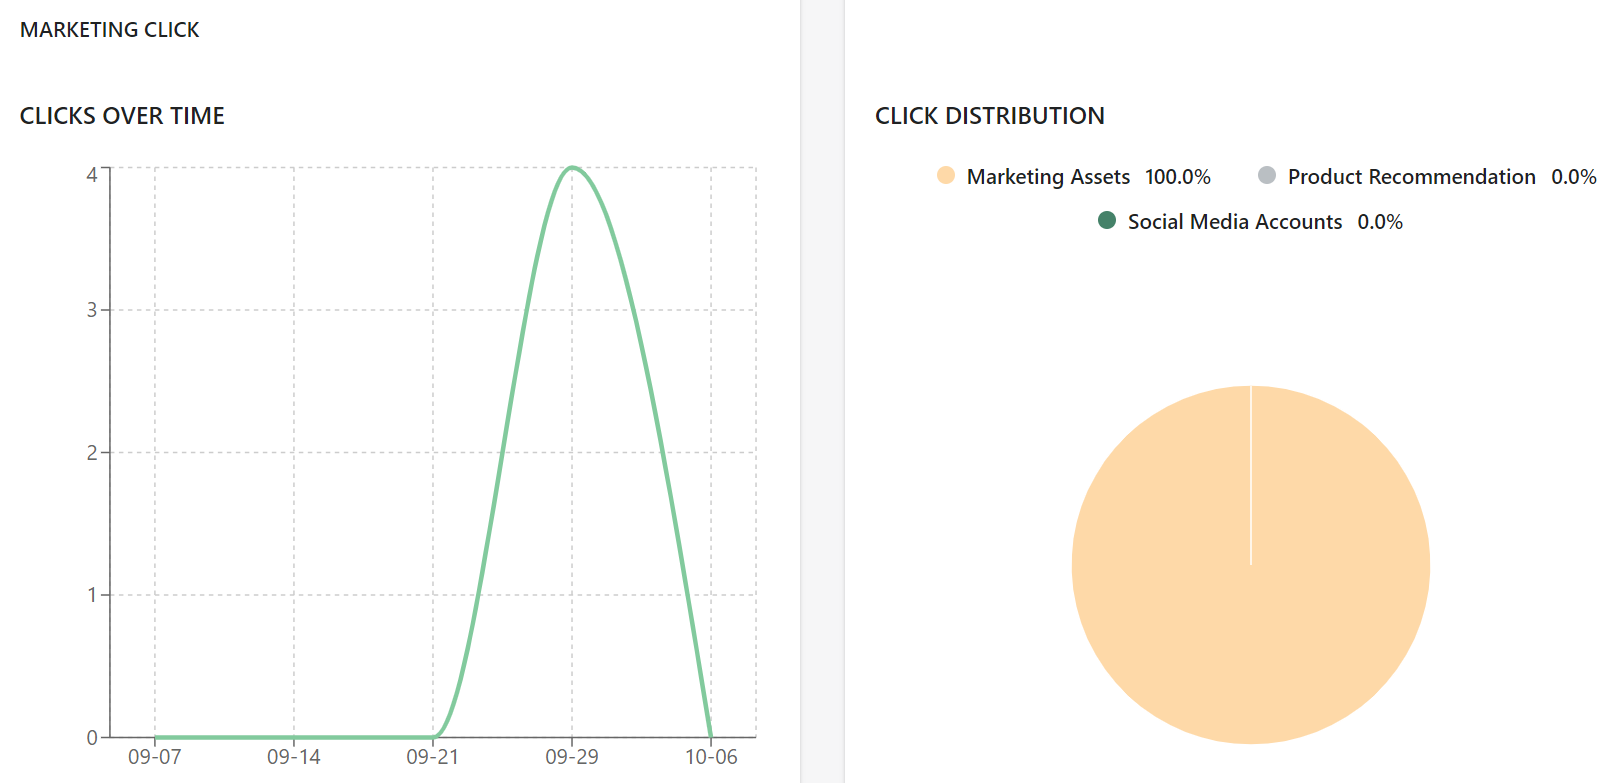
- Marketing clicks number + Marketing clicks graphs
The charts show many clicks in marketing assets, social media, product recommendations the tracking page has been received in a time range and in comparison with the last period.
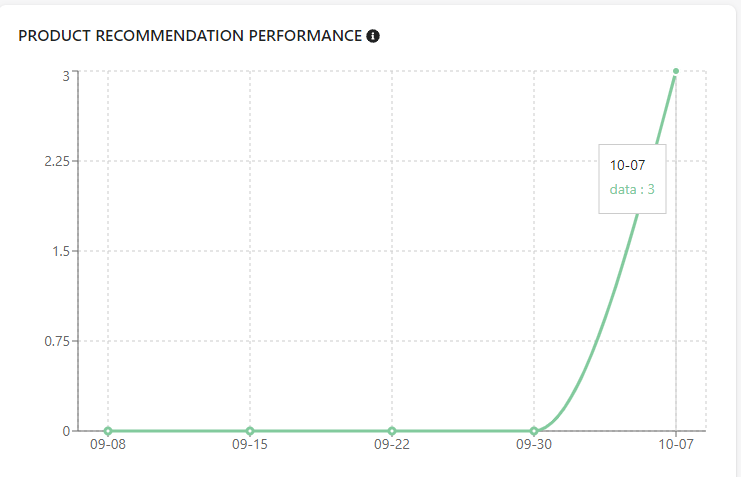
- Product recommendation performance
The chart shows how many clicks in Product recommendations the tracking page has been received. We count the number of clicks to the Product Recommendation action over time.
-
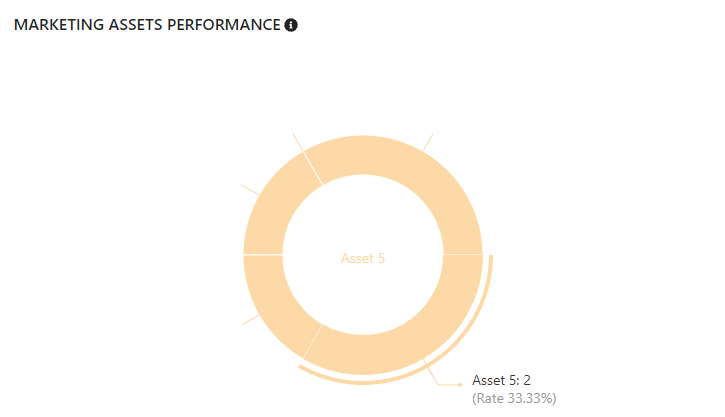
Marketing assets performance
We calculate the percentages that each asset position contributes to the total clicks. The assets order is counted from left to right, then from top to bottom.
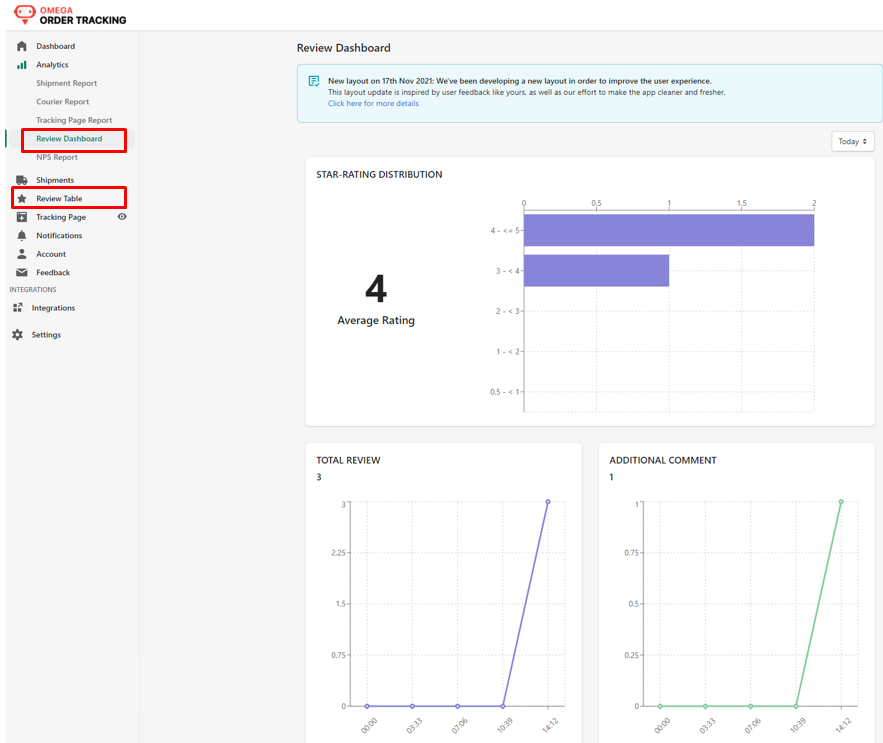
4. Review Dashboard
The charts show Average Rating, Total Review, and Additional comments collected from Real Reviews written by your customers. The data is pulled from the Review table
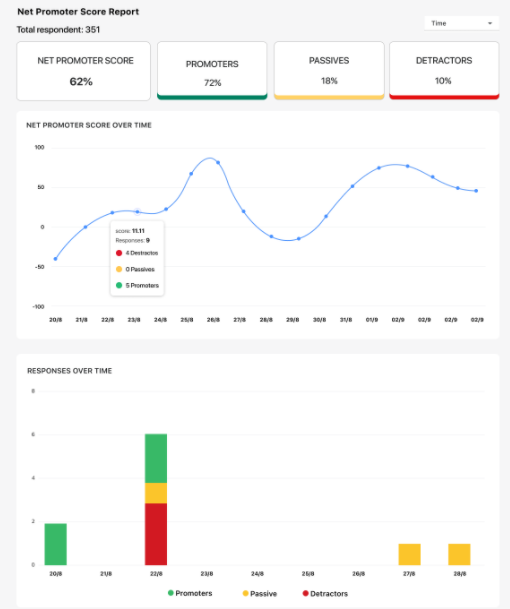
5. Net Promoter Score Report
The data is calculated through NPS (Net promoter score) question suggested in question 2 of asking review setting: How likely would you recommend us (to your friends and family)?
Formula:
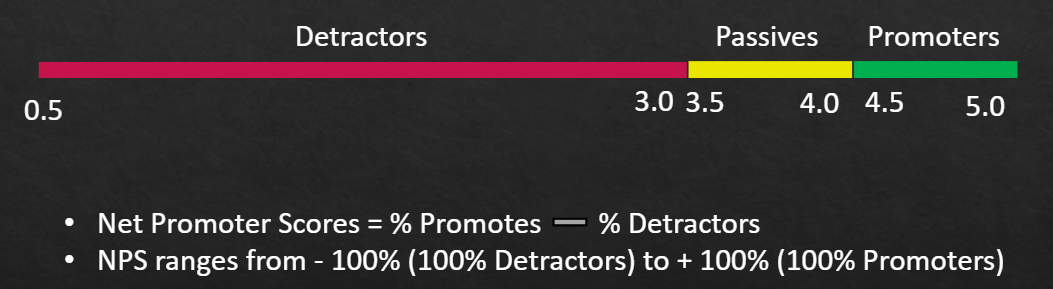
As the result, this section shows:
- How many respondents did you receive
- Percentage of Promoters, Passives, and Detractors
- NPS over time graph: It shows how the NPS® changes over time
- Responses over time graph: The distribution of response (categorized by Promoters, Passives, and Detractors) over time
No questions yet.